
You Have Six Months of Runway. Or Is It Eight? Wait, Four?
Your board meeting is in two hours. Someone asks: "What's our current burn rate and how much runway do we have?"
You open QuickBooks. Check last month's expenses. Pull up bank statements. Open that spreadsheet your finance lead maintains. The numbers... don't quite line up.
QuickBooks shows $76K in outflows last month. But that includes a one-time software purchase. And that deferred revenue payment. And wait, did we already pay that vendor invoice or is it still pending?
Your bank balance says one thing. Your accounting software says another. Your runway calculation spreadsheet—last updated three weeks ago—says something else entirely.
So you do what every finance team does: rebuild the analysis from scratch. Categorize cash inflows (recurring revenue, supplementary revenue, non-revenue payments). Break down cash outflows (COGS, operating expenses broken into OpEx and CapEx categories). Calculate net cash flow. Divide by burn rate. Hope the number you present doesn't change by tomorrow.
Turns out, "how much runway do we have?" shouldn't require a research project every time someone asks.
The Cash Flow Visibility Gap
Most startups track their bank balance. Obviously. You know how much cash you have today.
But knowing your balance isn't the same as understanding your cash flow. You can't see the breakdown of what's driving cash in and out. You don't know if last month's spike in expenses was a trend or an anomaly. You can't easily separate recurring costs from one-time capital expenditures.
So your cash flow analysis lives in multiple places:
Your accounting software (Xero, QuickBooks, NetSuite) has transactions. Lots of transactions. But categorization is inconsistent. Reports are backward-looking. And nobody outside finance can access it anyway.
Your bank feeds show real-time balances. But they don't show why cash moved. A $50K outflow could be payroll (recurring burn) or a one-time software license (CapEx). Your bank doesn't care. It just shows the number.
Someone's spreadsheet tries to tie it together. Cash flow projections. Burn rate calculations. Runway estimates. It's updated manually. Usually right before board meetings. It's definitely accurate as of... whenever someone last touched it.
So when your CEO asks about runway, you're rebuilding the picture. When your investors want to see burn rate trends, you're exporting CSVs and making charts. When department leads need budget context, they get nothing—finance data is locked away in systems they can't access.
And here's the killer: your entire company is making decisions without understanding the cash position. Engineering doesn't know that the burn rate jumped 30% last quarter. Marketing doesn't see that customer acquisition is bringing in less cash than expected. Product doesn't realize that the new enterprise deal took 60 days to actually collect payment.
Everyone's operating blind.
What If Cash Flow Was Actually Visible?
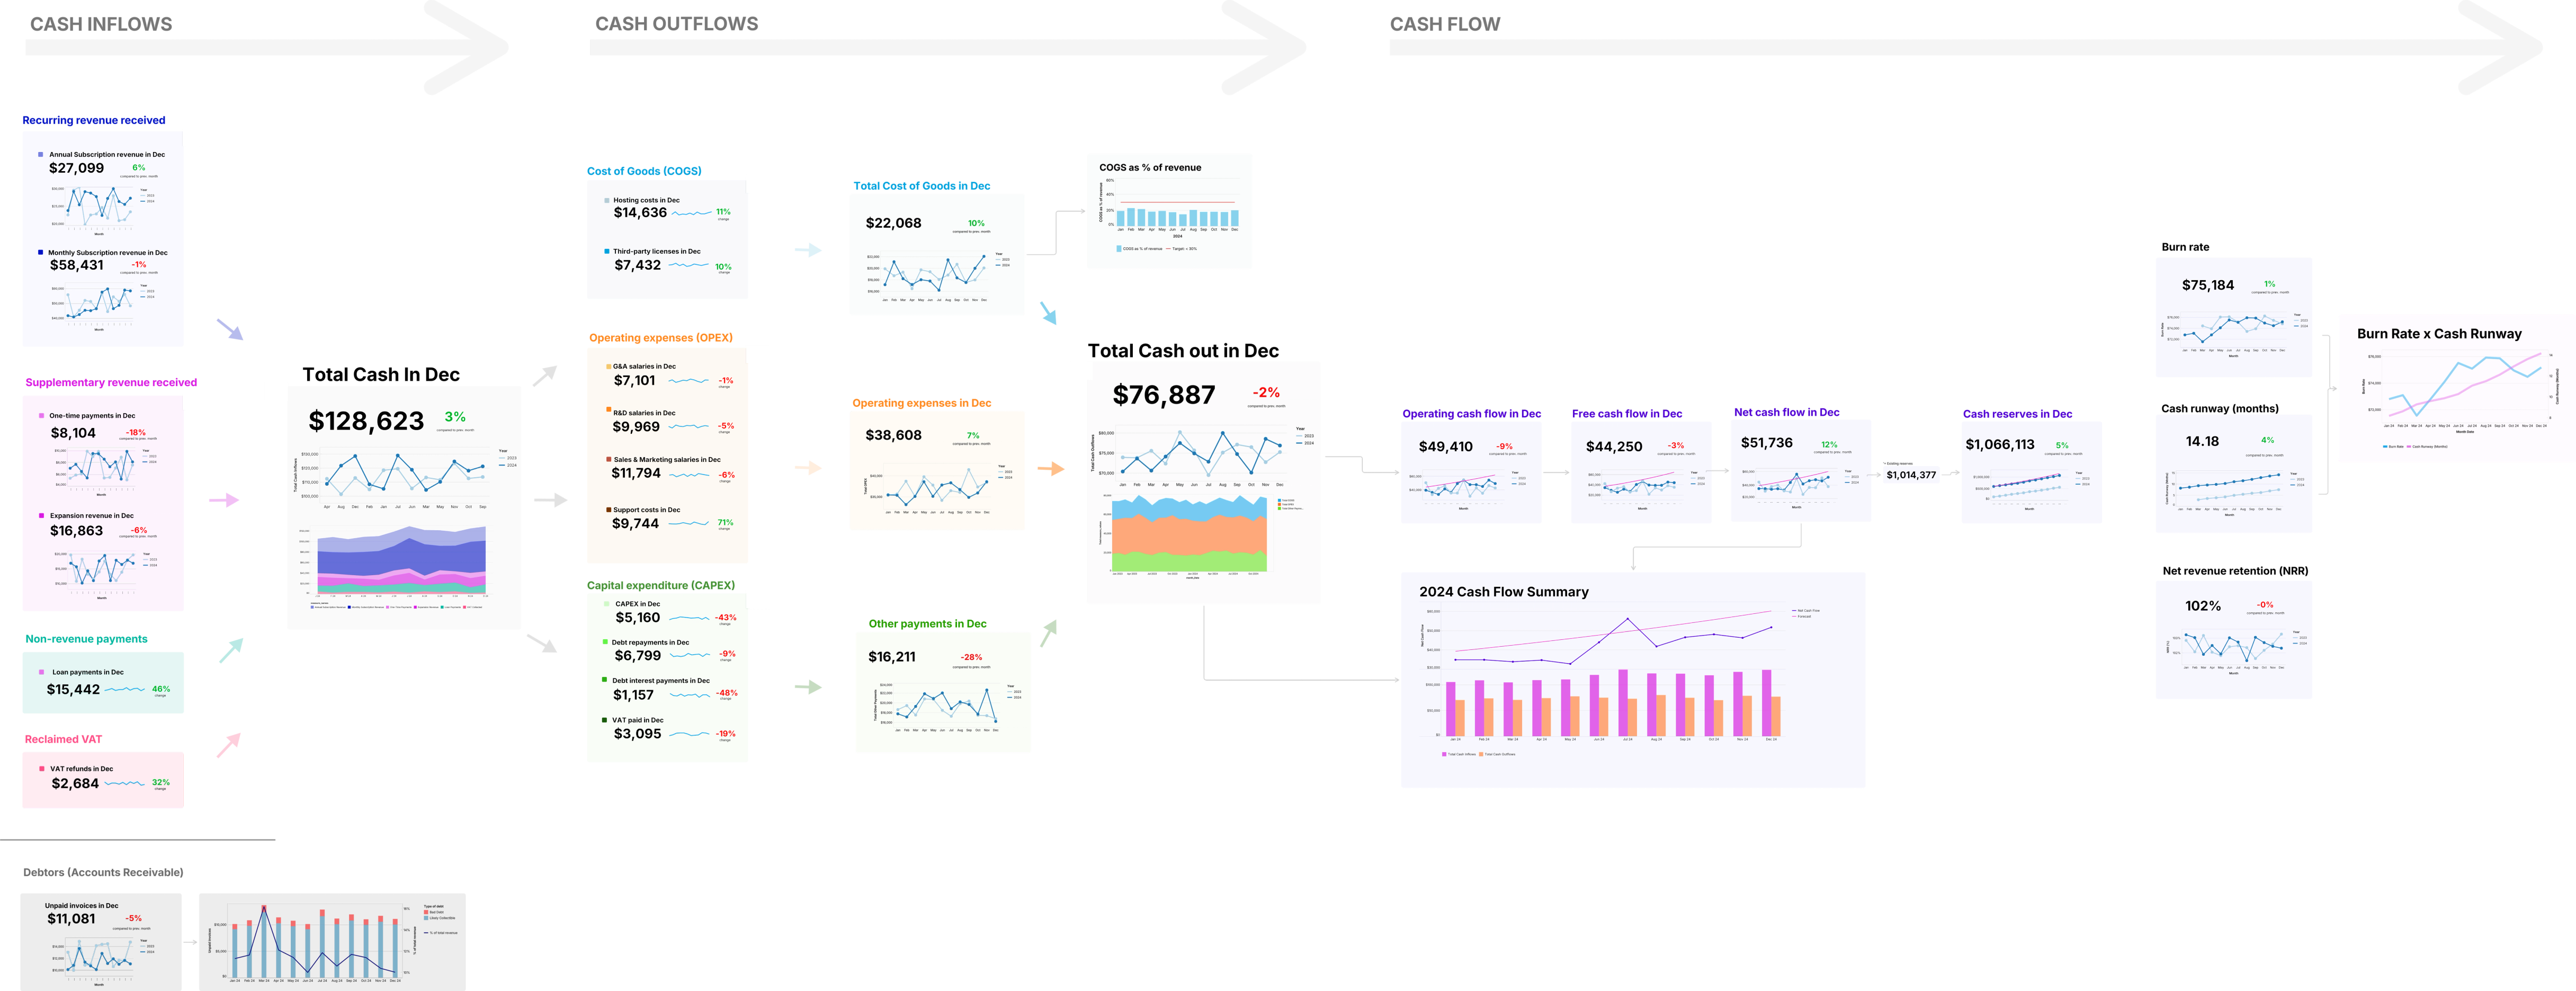
Count's cash flow canvas shows inflows, outflows, and net cash flow in one place—with the breakdowns that actually matter.
Left column: Cash inflows. Recurring revenue received (your predictable cash). Supplementary revenue (one-time payments, services, whatever doesn't repeat). Non-revenue payments (refunds, investments, anything that increases cash but isn't revenue). Each category with its own metrics and trends.
Middle column: Cash outflows. Cost of Goods Sold broken down (total, per-unit costs, etc.). Operating expenses split between OpEx (recurring operational costs) and CapEx (capital expenditures, software purchases, equipment). Each with historical trends showing if burn is accelerating or stabilizing.
Right column: Net cash flow. Total cash in minus total cash out. Burn rate calculated automatically. Cash runway showing exactly how many months you have at current burn. Monthly cash flow summary showing the pattern over time. Net revenue retention and other health metrics.
Which is a fancy way of saying: everyone in your company can finally see the cash position without asking finance to rebuild a deck.
Your CFO sets it up once—connects to your accounting system or data warehouse, defines the categories that match your business model. After that, it updates automatically. Board meeting next week? The numbers are already there. CEO asks about runway? Pull up the canvas—14.18 months based on current $76,887 monthly burn.
And because it's a canvas, your team can collaborate on it. Your VP of Engineering spots operating expenses trending up and drops a comment: "Hiring three people next month—burn will increase to ~$85K." Your finance lead adds context to a spike in capital expenditures: "Annual software renewals—one-time, not recurring." Your CEO sees cash reserves dropping and starts a discussion thread about extending runway.
Real-time visibility. Company-wide access. No more manually updating spreadsheets before every single meeting.
Done.
From Panic to Planning
Here's what changes when cash flow is visible:
Board meetings get easier. The numbers are always current. Burn rate, runway, cash flow trends—it's all there. No more scrambling to rebuild analysis two hours before the meeting.
The company gets context. When everyone can see cash flow, they make better decisions. Engineering knows when to slow hiring. Marketing understands when customer acquisition costs are unsustainable. Product sees when big deals aren't translating to collected cash.
You spot problems early. Burn rate creeping up? You see it immediately, not three months later when runway is suddenly critical. Cash collections slowing? It's visible in real-time, not when you manually reconcile at quarter-end.
The reality is: cash is what keeps startups alive. Not revenue. Not bookings. Not ARR. Cash.
But most companies treat cash flow like a monthly chore—export from accounting, categorize in spreadsheets, calculate burn, present to leadership, repeat next month.
Build your cash flow canvas once. Connect it to your accounting system. Break down inflows and outflows in ways that make sense for your business. And finally answer "how much runway do we have?" with confidence instead of spreadsheet archaeology.