
Your Marketing Team Drives Leads. Your MRR Is Still Flat. Why?
Your CMO just presented at the quarterly business review. Lead generation is up 23%. Trial signups are growing. Enterprise pipeline looks healthy. Everyone claps.
Then your CFO shows the next slide. MRR is... basically flat. Up 2% from last quarter. Nowhere near the growth rate your board expects.
Someone asks: "If leads are up 23%, why isn't revenue growing?"
Crickets.
Here's why nobody can answer: your marketing team tracks channels (organic, paid, email, referral, social). Your sales team tracks pipeline (enterprise new business, expansion opportunities). Your finance team tracks MRR (new, expansion, retained, contraction, churned).
But nobody's connected the dots. You can't trace organic traffic through to actual MRR contribution. You don't know if trial signups convert better than enterprise deals. You can't see whether expansion revenue is offsetting churn or if you're just treading water.
Your metrics are siloed by team. Marketing owns top-of-funnel. Sales owns middle-of-funnel. Finance owns the outcome. And somewhere in that handoff, the story breaks down.
Turns out, "leads are up" doesn't mean much if you can't tie it to revenue.
The Attribution Black Hole
Most B2B SaaS companies track MRR. Obviously. It's the number that matters.
Some break it down: new MRR, expansion MRR, churned MRR, contraction, retained. Great. Now you know whatchanged.
But you still don't know why.
Why is new MRR growing but net MRR flat? (Because churn is accelerating.) Why is churn accelerating? (Is it a product issue? A customer segment problem? Bad-fit customers from a specific acquisition channel?)
Your marketing team can tell you that referral traffic converts 3x better than paid social. Cool. But does referral-sourced MRR have better retention? Higher expansion rates? Lower churn? Nobody knows, because attribution stops at "converted to trial" or "became a SQL."
Your sales team can tell you enterprise deals take 90 days to close. Great. But what's the MRR contribution compared to self-serve trial signups that convert in 14 days? Are you over-investing in enterprise motion for marginal revenue gains? Again, nobody knows.
So you make decisions based on incomplete data:
- Marketing doubles down on paid ads because "volume is up" (ignoring that those customers churn faster)
- Sales prioritizes enterprise deals because "ACV is higher" (ignoring that PLG trials convert to expansion revenue at 2x the rate)
- Product focuses on features for enterprise because "that's where the big deals are" (ignoring that self-serve is actually driving most net new MRR)
Same company, completely misaligned incentives.
What a Complete B2B Metric Map Looks Like
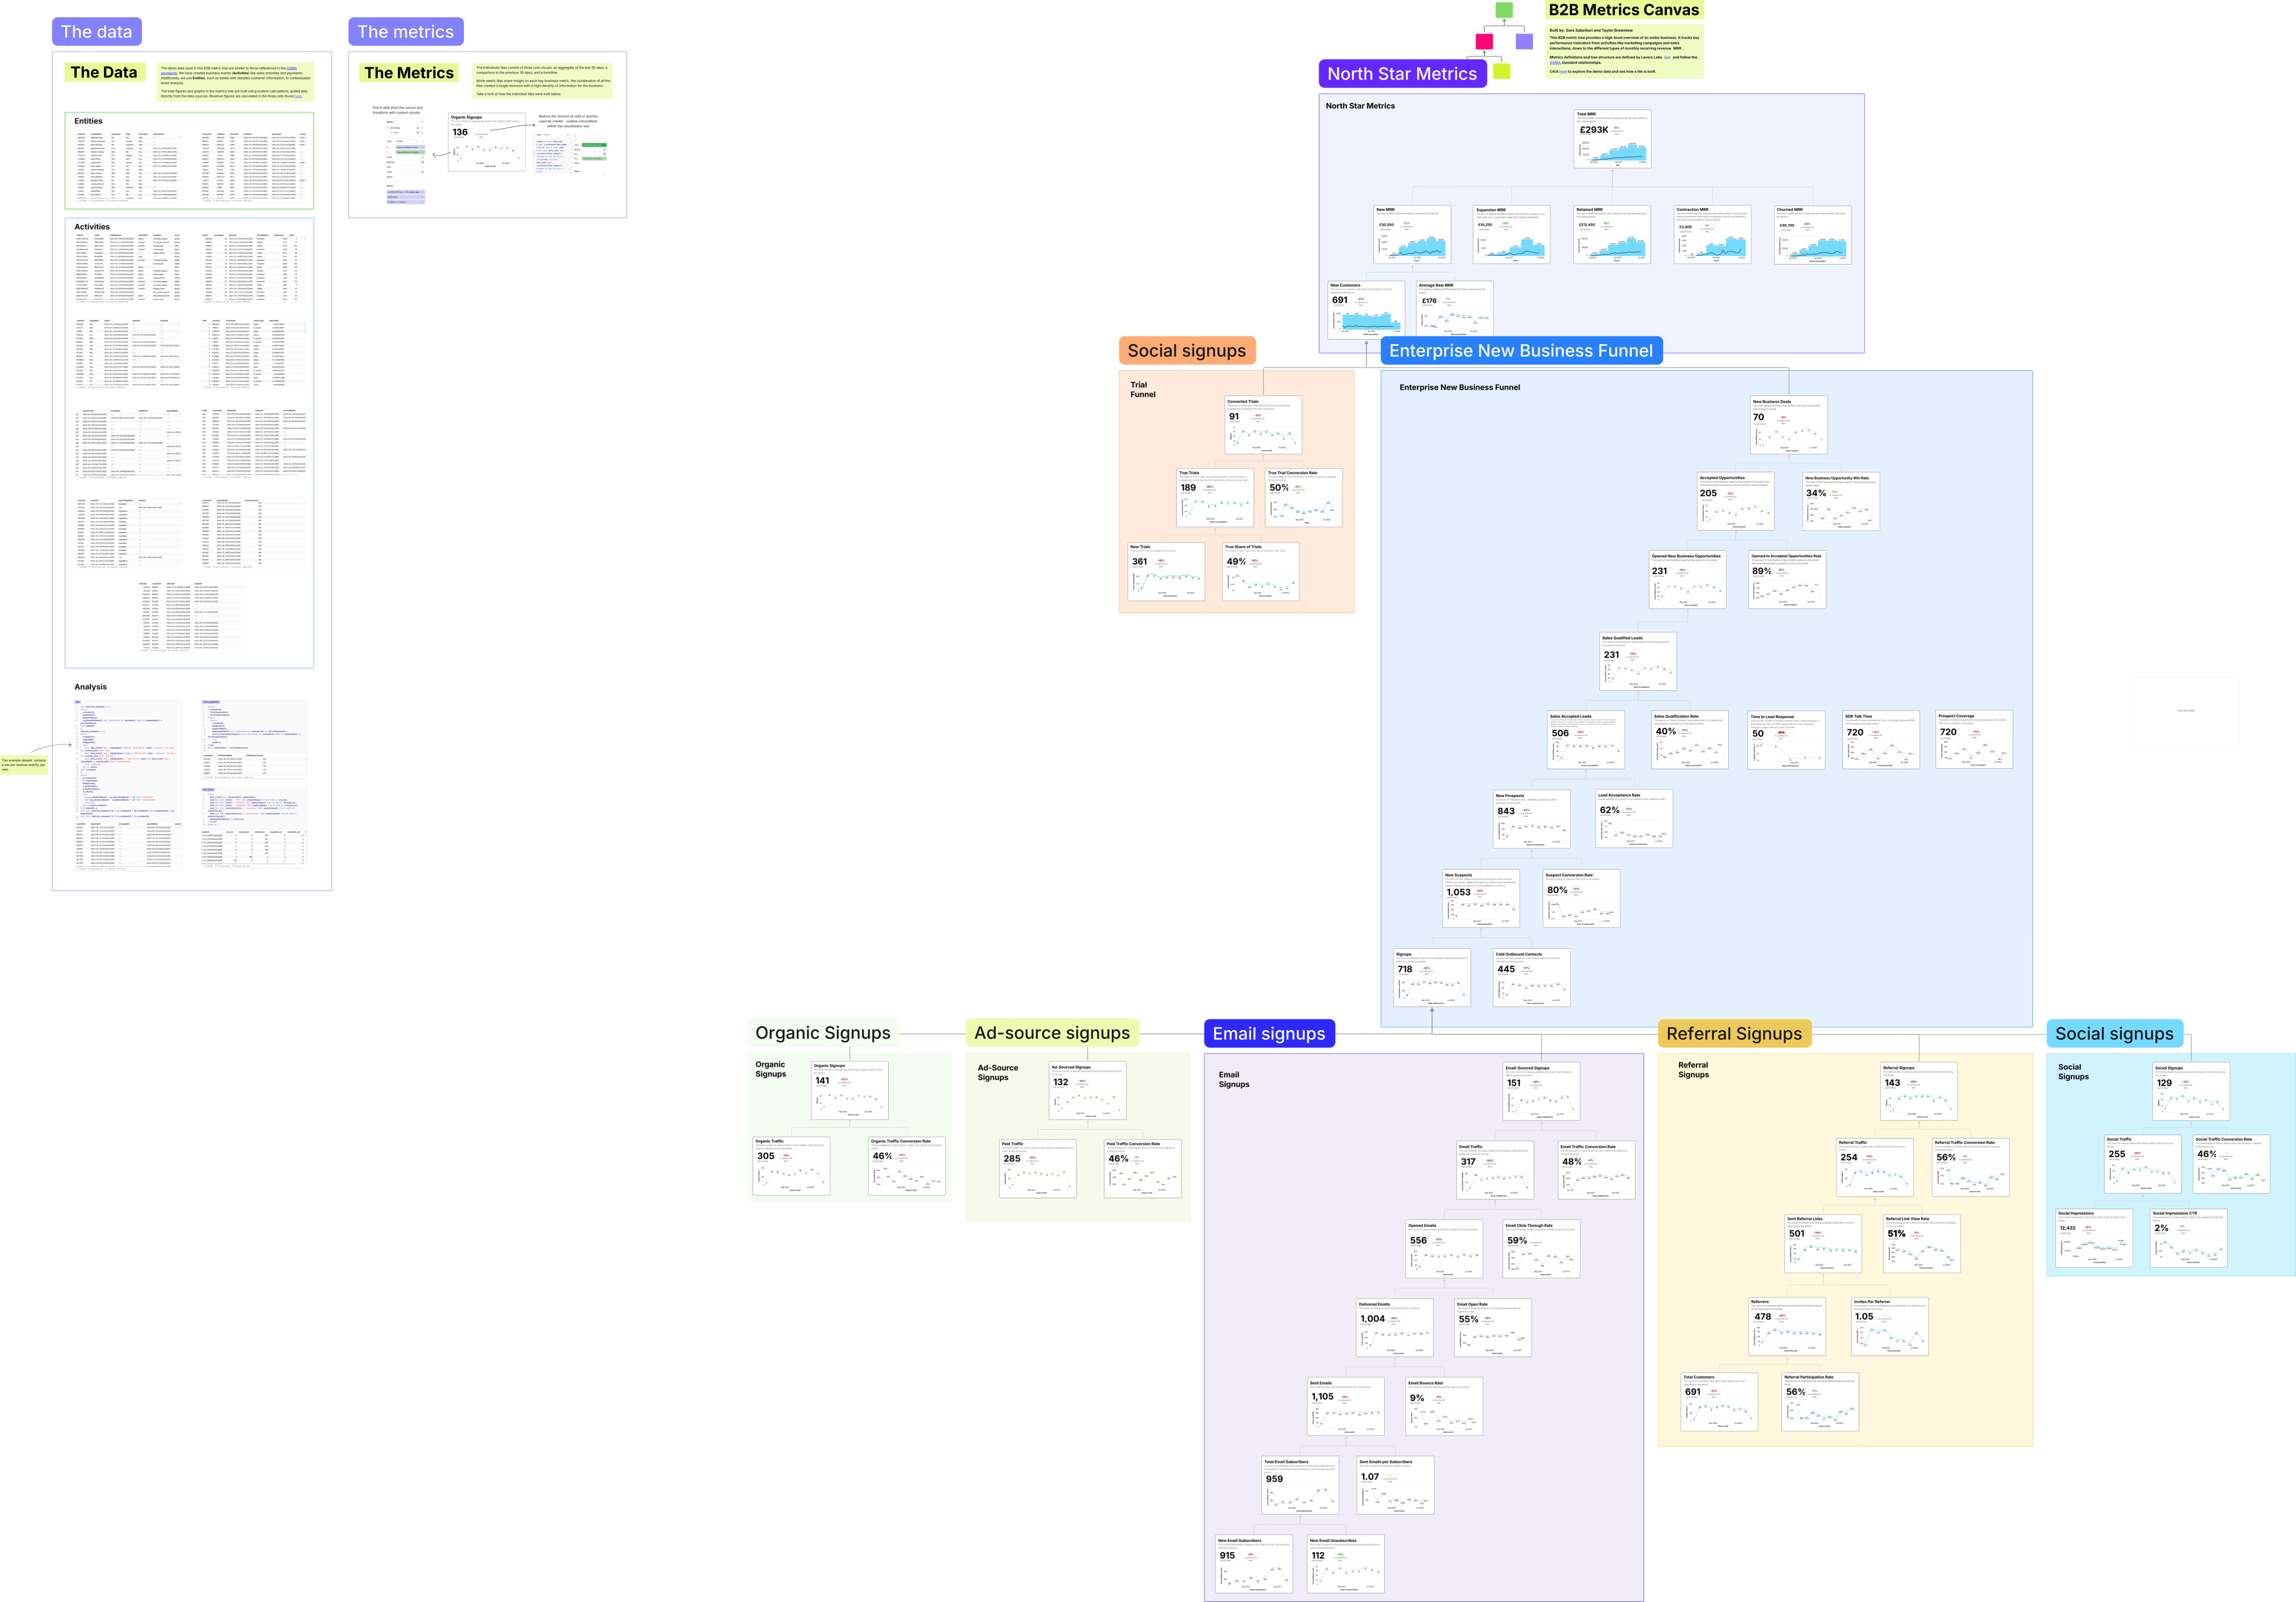
Count's B2B SaaS metric map—based on the SOMA framework—shows the full picture. It's massive. Probably more comprehensive than any single company needs. But it shows what's possible when you actually connect your metrics.
Top level: MRR as your north star.
Second level: MRR broken into components—new MRR, expansion, retained, contraction, churned. Now you know what's changing.
Third level: New MRR splits two ways—self-serve trial signups and enterprise new business. Different motions, different attribution, different conversion timelines. Both feeding the same outcome.
Fourth level: Channels. Organic, paid ads, email, referral, social. For both PLG trials and enterprise. Volume metrics. Conversion rates. All the way through to actual MRR contribution.
Every metric connected. Every channel traced to revenue. Every team's work visible in context.
Is this overkill for most companies? Absolutely. Most B2B SaaS businesses don't need to track all of this. But seeing the complete map helps you figure out which parts matter for your business.
Your PLG motion might be driving 70% of new MRR through organic and referral, while your enterprise team is burning budget on paid ads that generate pipeline but terrible conversion. You can't see that unless you map it.
Your expansion revenue might be coming entirely from self-serve customers who upgraded after 90 days, while your big enterprise logos never expand. You can't prioritize that unless you trace it.
Your churn might be concentrated in customers acquired through a specific channel six months ago. You can't fix that unless you connect attribution all the way through retention.
Build what you need. Ignore the rest. But at least see the possibility space.
From Siloed Metrics to Revenue Intelligence
Here's what changes when your B2B metrics are fully mapped:
Marketing gets accountability beyond leads. Don't just track "lead volume up 23%"—track which channels contribute to new MRR, expansion, and retention. Optimize for revenue, not vanity metrics.
Sales sees the full picture. Enterprise deals feel important, but if PLG customers have higher LTV and faster payback, maybe resource allocation should shift. Data decides, not opinions.
Finance stops being the bearer of bad news. When MRR moves, everyone can see why. New customer acquisition slowing? Churn accelerating? Expansion stalling? The map shows you.
The reality is: B2B SaaS revenue is complex. You have self-serve and sales-led motions. Multiple acquisition channels. Expansion and contraction happening simultaneously. New customer growth masking churn problems (or vice versa).
Most companies track pieces of this. Few companies connect it all the way through.
MRR is your north star. New, expansion, retained, contraction, and churn are the components. Trial signups and enterprise deals are the drivers. Organic, paid, email, referral, and social are the sources.
Map it once. Connect every metric to revenue. And finally answer "why is MRR flat when leads are up?" without guessing.